1992 United States presidential election in Wyoming
The 1992 United States presidential election in Wyoming took place on November 3, 1992, as part of the 1992 United States presidential election . Voters chose three representatives, or electors to the Electoral College , who voted for president and vice president .
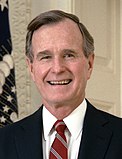
Wyoming was won by incumbent President George H. W. Bush (R -Texas ) with 39.70 percent of the popular vote over Governor Bill Clinton (D -Arkansas ) with 34.10 percent. Businessman Ross Perot (I -Texas) finished in third, with 25.65 percent of the popular vote.[ 1] 1948 , when it narrowly voted for Harry S. Truman over Thomas E. Dewey .[ 2] 2024 this is the last time in which the state was decided by single digits. As of the 2024 presidential election [update] Natrona County and Carbon County voted for the Democratic candidate.[ 3] Jimmy Carter won Sweetwater County in 1976 , and the first time Teton County voted for a Democratic presidential candidate since it voted for Franklin D. Roosevelt over Wendell Willkie in 1940 .[ 4]
Results
Results by county
County
George H.W. Bush
Bill Clinton
Ross Perot
Various candidates[ 5]
Margin
Total votes cast
#
%
#
%
#
%
#
%
#
%
Albany
4,176
32.46%
5,713
44.40%
2,862
22.24%
116
0.90%
-1,537
-11.94%
12,867
Big Horn
2,216
46.54%
1,216
25.54%
1,236
25.96%
94
1.97%
980[ a]
20.58%
4,762
Campbell
5,315
47.42%
2,709
24.17%
3,133
27.95%
51
0.46%
2,182[ a]
19.47%
11,208
Carbon
2,320
34.74%
2,737
40.99%
1,579
23.64%
42
0.63%
-417
-6.25%
6,678
Converse
2,159
45.44%
1,307
27.51%
1,260
26.52%
25
0.53%
852
17.93%
4,751
Crook
1,377
51.32%
568
21.17%
718
26.76%
20
0.75%
659[ a]
24.56%
2,683
Fremont
5,387
38.77%
4,765
34.29%
3,594
25.86%
150
1.08%
622
4.48%
13,896
Goshen
2,395
45.04%
1,754
32.98%
1,144
21.51%
25
0.47%
641
12.06%
5,318
Hot Springs
978
40.77%
740
30.85%
652
27.18%
29
1.21%
238
9.92%
2,399
Johnson
1,614
51.30%
656
20.85%
844
26.83%
32
1.02%
770[ a]
24.47%
3,146
Laramie
12,890
40.46%
12,177
38.23%
6,607
20.74%
181
0.57%
713
2.23%
31,855
Lincoln
2,595
45.08%
1,430
24.84%
1,495
25.97%
237
4.12%
1,100[ a]
19.11%
5,757
Natrona
9,717
35.46%
9,817
35.83%
7,647
27.91%
219
0.80%
-100
-0.37%
27,400
Niobrara
635
48.85%
298
22.92%
355
27.31%
12
0.92%
280[ a]
21.54%
1,300
Park
5,218
46.55%
2,771
24.72%
3,145
28.06%
75
0.67%
2,073[ a]
18.49%
11,209
Platte
1,668
41.18%
1,398
34.51%
956
23.60%
29
0.72%
270
6.67%
4,051
Sheridan
4,303
37.21%
4,139
35.79%
3,035
26.24%
88
0.76%
164
1.42%
11,565
Sublette
1,168
45.38%
536
20.82%
828
32.17%
42
1.63%
340[ a]
13.21%
2,574
Sweetwater
4,476
30.02%
6,417
43.04%
3,879
26.02%
138
0.93%
-1,941
-13.02%
14,910
Teton
2,854
34.05%
3,120
37.22%
2,340
27.92%
68
0.81%
-266
-3.17%
8,382
Uinta
2,701
39.12%
2,047
29.65%
2,041
29.56%
116
1.68%
654
9.47%
6,905
Washakie
1,720
43.19%
1,118
28.08%
1,084
27.22%
60
1.51%
602
15.11%
3,982
Weston
1,465
48.40%
727
24.02%
829
27.39%
6
0.20%
636[ a]
21.01%
3,027
Totals
79,347
39.55%
68,160
33.97%
51,263
25.55%
1,855
0.92%
11,187
5.58%
200,625
County flips from 1988: Democratic Hold
Gain from Republican
Republican Hold
Counties that flipped from Republican to Democratic
See also
Notes
^ a b c d e f g h i In this county where Clinton ran third behind Bush and Perot, margin given is Bush vote minus Perot vote and percentage margin Bush percentage minus Perot percentage.
References


