Share to:


1995 Basildon District Council election

1995 Basildon District Council election[1][2]

← 1994 4 May 1995 1996 →

14 of the 42 seats to Basildon District Council
22 seats needed for a majority
  First party Second party Third party
 
Party Labour Conservative Liberal Democrats
Seats before 13 19 8
Seats won 8 0 6
Seats after 16 14 12
Seat change Increase3 Decrease5 Increase4
Popular vote 22,614 13,124 10,994
Percentage 48.3% 28.0% 23.5%

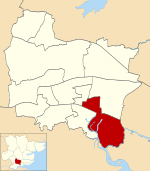
Map showing the results of contested wards in the 1995 Basildon Borough Council elections.

Council control before election

No overall control

Council control after election

No overall control

The 1995 Basildon District Council election took place on 4 May 1995 to elect members of Basildon District Council in Essex, England. This was on the same day as other local elections. One third of the council was up for election; the seats which were last contested in 1991. The council remained under no overall control.

Overall results

1995 Basildon District Council Election
Party Seats Gains Losses Net gain/loss Seats % Votes % Votes +/−
  Labour 8 3 0 Increase3 57.1 48.3 22,614 Increase18.3
  Liberal Democrats 6 4 0 Increase4 42.9 23.5 10,994 Decrease1.7
  Conservative 0 0 7 Decrease7 0.0 28.0 13,124 Decrease16.8
  Militant Labour 0 0 0 Steady 0.0 0.2 86 New
Total 14 46,818

All comparisons in vote share are to the corresponding 1991 election.

Ward results

Billericay East

Location of Billericay East ward
Billericay East[3]
Party Candidate Votes %
Liberal Democrats F. Bellard 1,499 42.1%
Conservative B. Lea 1,323 37.1%
Labour P. Clark 742 20.8%
Turnout 40.3%
Liberal Democrats gain from Conservative

Billericay West

Location of Billericay West ward
Billericay West[3]
Party Candidate Votes %
Liberal Democrats J. Macpherson 1,876 46.1%
Conservative F. Tomlin 1,673 41.1%
Labour R. Bessell 524 12.9%
Turnout 40.2%
Liberal Democrats gain from Conservative

Burstead

Location of Burstead ward
Burstead[3]
Party Candidate Votes %
Liberal Democrats G. Bellard 1,451 43.0%
Conservative G. Buckenham 1,291 38.3%
Labour A. Lockyer 631 18.7%
Turnout 39.4%
Liberal Democrats gain from Conservative

Fryerns Central

Location of Fryerns Central ward
Fryerns Central[3]
Party Candidate Votes %
Labour P. Charles 2,513 77.7%
Conservative W. Marck 442 13.7%
Liberal Democrats K. Tyson 280 8.7%
Turnout 40.5%
Labour hold

Fryerns East

Location of Fryerns East ward
Fryerns East[3]
Party Candidate Votes %
Labour A. Dove 2,214 77.1%
Conservative S. Evens 408 14.2%
Liberal Democrats J. Lutton 250 8.7%
Turnout 37.1%
Labour hold

Laindon

Location of Laindon ward
Laindon[3]
Party Candidate Votes %
Labour T. Weldon 2,027 56.1%
Conservative V. York 1,271 35.2%
Liberal Democrats M. Martin 313 8.7%
Turnout 40.4%
Labour gain from Conservative

Langdon Hills

Location of Langdon Hills ward
Langdon Hills[3]
Party Candidate Votes %
Labour R. Sears 2,103 57.4%
Conservative S. Horgan 1,232 33.6%
Liberal Democrats S. Evans 327 8.9%
Turnout 40.1%
Labour gain from Conservative

Lee Chapel North

Location of Lee Chapel North ward
Lee Chapel North[3]
Party Candidate Votes %
Labour L. Gordon 2,467 79.5%
Conservative M. Amson 638 20.5%
Turnout 41.0%
Labour hold

Nethermayne

Location of Nethermayne ward
Nethermayne[3]
Party Candidate Votes %
Liberal Democrats J. White 1,548 43.6%
Conservative S. Caira-Neeson 1,362 38.4%
Labour S. Elliott 640 18.0%
Turnout 51.3%
Liberal Democrats hold

Pitsea East

Location of Pitsea East ward
Pitsea East[3]
Party Candidate Votes %
Labour C. Alderson 2,045 62.7%
Conservative R. Sheridan 841 25.8%
Liberal Democrats D. Neale 289 8.9%
Militant (Trotskyist group) D. Murray 86 2.6%
Turnout 30.5%
Labour gain from Conservative

Pitsea West

Location of Pitsea West ward
Pitsea West[3]
Party Candidate Votes %
Labour D. Abrahall 2,090 76.7%
Conservative H. Marshall 425 15.6%
Liberal Democrats L. Williams 210 7.7%
Turnout 32.0%
Labour hold

Vange

Location of Vange ward
Vange[3]
Party Candidate Votes %
Labour M. Bruce 1,894 76.8%
Conservative S. Hillier 385 15.6%
Liberal Democrats F. Thomas 186 7.5%
Turnout 32.7%
Labour hold

Wickford North

Location of Wickford North ward
Wickford North[3]
Party Candidate Votes %
Liberal Democrats C. Sweeney 1,432 38.6%
Conservative A. Sharpe 1,226 33.0%
Labour C. Wilson 1,056 28.4%
Turnout 40.0%
Liberal Democrats gain from Conservative

Wickford South

Location of Wickford South ward
Wickford South[3]
Party Candidate Votes %
Liberal Democrats A. Banton 1,333 36.9%
Conservative D. Morris 1,329 36.8%
Labour B. Sime 946 26.2%
Turnout 36.5%
Liberal Democrats hold

References

  1. ^ "Council compositions by year". The Elections Centre.
  2. ^ "Local Election Summaries 1995". The Elections Centre.
  3. ^ a b c d e f g h i j k l m n "Basildon District Council Election Results 1973–2012" (PDF). Elections Centre. Retrieved 3 August 2019.
Kembali kehalaman sebelumnya