|
Demographics of Alaska

 As of 2020, Alaska has a population of 733,391. In 2005, the population of Alaska was 663,661, which is an increase of 5,906, or 0.9%, from the prior year and an increase of 36,730, or 5.9%, since the year 2000.[2] This includes a natural increase since the last census of 36,590 people (53,132 births minus 16,542 deaths) and an increase due to net migration of 1,181 people into the state. Immigration from outside the United States resulted in a net increase of 5,800 people, and migration within the country produced a net loss of 4,619 people. More than half of the state's population lives in Anchorage, Juneau and Fairbanks, with two-fifths in Anchorage alone. The Matanuska-Susistna Borough is one of the nation's fastest growing areas, with an estimated population of 100,000 and projections of 130,000 by 2027.[3] The last census of the Matanuska-Susitna Borough in 2019 showed a population of 108,317.[4] The Matanuska-Susitna Borough contains the incorporated townships of Wasilla and Palmer and is home to an indigenous population, The Dena'ina people have been in the area for 10,000 years. Knik Tribal Council is a federally recognized tribe in the MAT-SU and a non-profit social service organization for Natives in the MAT-SU region.[5] This area contains the cities of Meadow Lakes, Big Lake, Houston, Talkeetna, Willow. There are 54 cities, townships and other populated areas in the Matanuska-Susistna Borough.[6] With a population of 733,391, according to the 2020 U.S. census,[7] Alaska is the 49th most populous and least densely populated state. For purposes of the federal census, the state is divided into artificial divisions defined geographically by the United States Census Bureau for statistical purposes only. The center of population of Alaska is located approximately 64.37 kilometers (40.00 mi) east of Anchorage at 61.399882 N. latitude, 148.873973 W. longitude.[8] In 2006, Alaska had a larger percentage of tobacco smokers than the national average, with 24% of Alaskan adults smoking.[9] HistoryThe 1870 Census in Alaska was conducted by U.S. Army personnel under the command of Major General Henry W. Halleck. This count showed 82,400 people. But because of duplication of tribes listed under different names, the inclusion of a tribe that did not exist, and exaggerated estimates, the number was not considered reliable.[10] AncestryAccording to the 2020 United States census, the racial composition of Alaska was the following:[11]
The population was 7.7% of Hispanic or Latino origin (of any race). The largest ancestry groups (which the Census defines as not including racial terms) in the state are:[12]
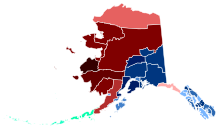
The vast and sparsely populated regions of northern and western Alaska are primarily inhabited by Alaska Natives, who are also numerous in the southeast. Anchorage, Fairbanks, and other parts of south-central and southeast Alaska have many White Americans of northern and western European ancestry. The Wrangell-Petersburg area has many residents of Scandinavian ancestry and the Aleutian Islands contain a large Filipino population. The vast majority of the state's Black population lives in Anchorage and Fairbanks. Also, Alaska has the largest percentage of American Indians of any state. Some of the Alaska Natives absorbed the small 1700s Russian-era settlement. There are some Creole people of natives and Russians mixture.
Birth dataNote: Births in table don't add up, because Hispanics are counted both by their ethnicity and by their race, giving a higher overall number.
LanguagesAccording to the 2005-2007 American Community Survey, 84.7% of people over the age of five speak only English at home. About 3.5% speak Spanish at home. About 2.2% speak an Indo-European language other than Spanish or English at home, about 4.3% speak an Asian language at home and about 5.3% speak other languages at home. A total of 5.2% of Alaskans speak one of the state's 22 indigenous languages, known locally as "native languages". These languages belong to two major language families: Eskimo–Aleut and Na-Dené. As the homeland of these two major language families of North America, Alaska has been described as the crossroads of the continent, providing evidence for the recent settlement of North America via the Bering land bridge.
ReligionReligion in Alaska (2014)[24] Protestant Christian (36%) Roman Catholic (16%) Orthodox Christian (5%) Latter-day Saint (5%) Non-Christian religions (6%) Unaffiliated (31%) Don't know/refused answer (1%)

Other religions[24]
Alaska's relatively large Orthodox Christian population is notable. The large Eastern Orthodox population (with 49 parishes and up to 50,000 followers) stems from early Russian colonization of the Americas (which centered on Alaska), and from missionary work among Alaska Natives. In 1794 the first Russian Orthodox church was built in Kodiak by monks who had arrived from the Valaam Monastery. Intermarriage with Alaskan Natives helped Russian immigrants integrate into Alaskan societies. As a result, a number of Russian Orthodox parishes gradually became established in Alaska. As of 2021[update] many are affiliated with the Orthodox Church in America, while others are members of the Russian Orthodox Church Outside Russia. The first Sitka Lutheran Church was built for Finnish people in New Archangel (present-day Sitka) in 1843. Alaska has the largest Quaker population (by percentage) of any U.S. state.[25] As of 1994[update], 3,060 Jews lived in Alaska.[26] The number of Jehovah's Witnesses stands at a little less than 2,400. Estimates for the number of Alaskan Muslims range from 1,000 to 5,000.[27] See alsoReferences
External links |
|||||||||||||||||||||||||||||||||||||||||||||||||||||||||||||||||||||||||||||||||||||||||||||||||||||||||||||||||||||||||||||||||||||||||||||||||||||||||||||||||||||||||||||||||||||||||||||||||||||||||||||||||||||||||||||
