|
Economic geography of the United KingdomThe economic geography of the United Kingdom reflects its high position in the current economic league tables, as well as reflecting its long history as a trading nation and as an imperial power. This in turn was built on exploitation of natural resources such as coal and iron ore. Much has changed since Bevan's speech (below) in 1945, with the coalfields largely deserted and the Empire relinquished. With its dominant position gone, the UK economic geography is increasingly shaped by the one constant: it is a trading nation. "This island is made mainly of coal and surrounded by fish. Only an organising genius could produce a shortage of coal and fish at the same time."
Aneurin Bevan, From a speech in Blackpool, 25 May 1945 RegionsBetween 1998 and 2024, the UK economy grew by 41%, with the economies of Scotland (38%), Wales (40%) and Northern Ireland (38%) growing at varying rates.[1] The GDP of each area of the UK varies tremendously, with London having 10 times the GDP of Northern Ireland in 2022;[2] while London and the South East of England made up over a third of the national GDP, Northern Ireland, Wales and the North East of England combined made up less than a sixth. The GDP per capita showed similar variations with London having a GDP per head of £56,000 compared with the North East of England at £23,000 in 2024.[3] Different regions also see different rates of unemployment; in early 2024, the average UK unemployment rate was 4.3%, ranging from the East Midlands at 5.6% to Northern Ireland at 2.1%.[3] Agriculture, fossil fuels and manufacturingAgricultureThe UK has rarely been self-sufficient in terms of food supply. In 2023, the country was 54–60% self-sufficient in food.[4][5] In 2022, the country produced enough sheep and milk to be self-sufficient, and almost enough poultry, eggs and cereals, but other foods, such as rice, tomatoes and exotic fruits, had to be imported.[6] Its modern pattern of agriculture reflects a combination of history, current public policy and comparative advantage. Since the Enclosure Acts of the eighteenth century, the UK's uplands (including Wales and the Scottish Highlands) have largely been associated with animal husbandry and forestry. However, by the time of the Enclosure Acts, most of lowland Britain was already enclosed by processes such as assarting or illegal, but tolerated, piecemeal enclosure. However, evidence of the former open field system of agriculture can still be seen in some parts of the landscape, such as in the indentations remaining from boundary ditches of the former farming strips. Enclosure, in turn, led to intensification. Most UK agriculture is intensive and highly mechanised, with the use of chemical fertilisers and insecticides routine. By European standards it is very efficient, although that does not necessarily make it profitable. This intense nature was compounded in the post-War years, with fields being expanded at the expense of hedgerows. This process has been heavily criticised for damaging biodiversity. East Anglia and South East England have been centres for grain production, with some areas of South East England also specialising in market gardening. The county of Kent was so well known for this that it is often referred to as the Garden of England and was particularly noted for hop growing. Dairy farming is most prevalent in South West England. Northern Ireland is self-sufficient in food production and is able to export more than half of its meat and crops to the rest of the UK and beyond.[7][8] The detailed pattern of modern UK agriculture was heavily influenced by the Common Agricultural Policy of the European Union, with a combination of price support and set-aside policy. Around the edges of south eastern towns, perfectly good agricultural land often remains uncultivated as a result of price distortions created by the Metropolitan Green Belt. Indeed, since around 2001 speculators have been buying Green Belt agricultural land, generally adjacent to built up areas, and selling it off in plots, persuading buyers that the government will have to weaken Green Belt protection to solve the housing crisis (see below). It is hard to see when such plots could come back into production. Fossil fuelsThe UK's industry sector was once dominated by the coal; heavily concentrated in south Wales, north and south Staffordshire, Leicestershire and Derbyshire, South Yorkshire, Northumberland, County Durham, Fife and Midlothian. The number of pits and miners have been slashed, and output fell by more than 75% between 1981 and 2003. The remaining pits produced 17.2 million tonnes of oil equivalent in 2003, making the UK the 15th largest coal producing nation, compared with 4th in 1981, according to the BP Statistical Review of World Energy 2004. In 2021, the country had seven coal mines in operation, employing just over 6,000 people.[9] The major primary fossil fuel industry in the UK is North Sea oil. Its activity is concentrated on the east coast in Scotland and Northern England. The waters in the North Sea off the east coast of Scotland contain nearly half of the UK's remaining oil reserves, and a quarter of reserves are located in the North Sea near the Shetland Islands. As of January 2004, the UK had proven crude oil reserves of 4.7 billion barrels (750,000,000 m³) including onshore reserves, according to the Oil and Gas Journal. However, the number of people employed in this industry dropped dramatically during the 2010s.[10] A closely related industry is natural gas which, since the 1970s, has supplied all of the UK gas needs, replacing poisonous coal, or town, gas. Most natural gas production is in the North Sea, with a small amount onshore and in the Irish Sea. The largest reserves not related to oil production are in the southern North Sea between the UK and the Netherlands, although; the largest reserves, are associated with oil production. The UK has been a net natural gas importer since 2010.[11][12] Manufacturing
A map of the major UK cities gives a good picture of where manufacturing flourished, and often specialisations could be identified, in particular:
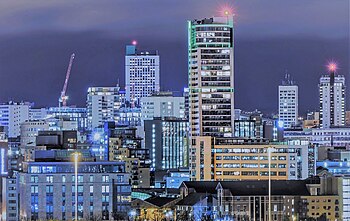
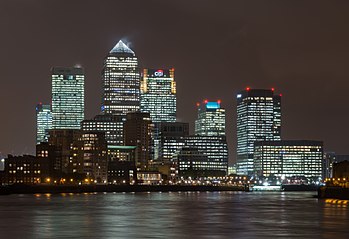
The automotive industry can be traced back to the 1890s (growing after World War I), by which time industries such as shipbuilding, textiles and steel were already established. In the inter-War years modern industries emerged, with aerospace forming clusters around London, Bristol and in Hertfordshire. The Hertfordshire cluster no longer exists. The early electronics industry generally preferred the south, especially the home counties. Today there is no heavy manufacturing industry in which UK-based firms can be considered world leaders and no product in which a UK city or region is the world leader.[16] However, the Midlands, in particular, remains a strong manufacturing centre, with around a fifth of employment dependent on manufacturing, and the East Midlands Development Agency has a policy to maintaining this characteristic. More recently, high technology firms have concentrated largely along the M4 motorway, partly because of access to London Heathrow Airport, but also because of the economies of agglomeration. However, the general pattern remains that the south has lower, and falling, reliance on manufacturing. Finance and services Once, every great city had a stock exchange. Now, the UK financial industry is concentrated overwhelmingly in the City of London and Canary Wharf, with back office and administrative operation often dispersed around the south of England. London is one of the world's great financial centres, which is one of the factors that is commonly considered to make it a world city. Central London contains some of the most expensive commercial property in the world because of this. From around the early 1990s London has been able to boast of having more U.S. banks than New York, as well as being host to branches of more than five hundred overseas banks. It is the principal financial centre of the world, ranked alongside New York and Tokyo as one of three where any serious financial player must be represented. The City of London has around 300,000 employees, largely concentrated in the financial and professional sectors. Within London, the desire for banks to be there put pressure on the City of London's ability to accommodate them. In the mid-1980s a crisis point was reached and, although the city was able to expand its stock of modern office space, this did not happen before Canary Wharf had been set up as a competitor. The irony is that Canary Wharf was built in the London Docklands that had, until 1970, been among the largest docks in the world. All manner of goods had been shipped from the factories of east London to the world; between 1961 and 1993 manufacturing employment in London fell from 1.6 million to 328,000.[17] During the mid-1990s, Leeds took advantage of the internet's arrival as part of the .com boom. It became the UK's first city to have full broadband and digital coverage, making it a very attractive place for corporations to expand, particularly when opening call centres. During the changing 1990s, Leeds had better connections to London than any other UK city, being 2 hours from London by train. As a result, it is now the UK's 2nd largest financial and legal centre,[18][19][20][21][22] and the UK's largest e-business sector with more than 1/3 of the UK's internet traffic passing through the city.[23] In this respect, Canary Wharf and Leeds are arguably more symbolic of the changed economic geography of the UK than any other place. Edinburgh is the 2nd financial capital of the UK. 2020sIn 2021, there were 2.3 million people employed in financial services in the UK; financial centres included Edinburgh, Glasgow, Cardiff, Belfast, London and several cities in England.[24] The country was also the world’s leading net explorer of financial services in 2020. By 2023, there were 2.5 million people employed in the industry, making up 12% of the UK economic output.[25]

See also
References
References and further reading
External links |