Share to:


Tiruchirappalli Lok Sabha constituency

Tiruchirappalli
Lok Sabha constituency
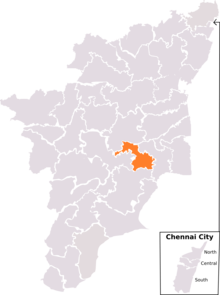
Tiruchirappalli constituency, post-2008 delimitation
Constituency details
CountryIndia
RegionSouth India
StateTamil Nadu
Assembly constituenciesSrirangam
Tiruchirappalli (West)
Tiruchirappalli (East)
Thiruverumbur
Gandharvakottai
Pudukkottai
Established1952
Total electors15,56,776[1]
ReservationNone
Member of Parliament
18th Lok Sabha
Incumbent
PartyMDMK
Elected year2024 Election

Tiruchirappalli is a Lok Sabha (Parliament of India) constituency in Tamil Nadu. Its Tamil Nadu Parliamentary Constituency number is 24 of 39.

Assembly segments

From 2009

The constituency comprises the following assembly segments:[2]

Constituency number Name Reserved for (SC/ST/None) District Member Party
139. Srirangam None Tiruchirappalli Palaniyandi. M DMK
140. Tiruchirappalli West None K. N. Nehru DMK
141. Tiruchirappalli East None Inigo S. Irudayaraj DMK
142. Tiruverumbur None Anbil Mahesh Poyyamozhi DMK
178. Gandharvakottai SC Pudukottai M. Chinnadurai CPI(M)
180. Pudukkottai None V. Muthuraja DMK

Before 2009

The constituency comprised

  1. Musiri (moved to Perambalur Constituency)
  2. Lalgudi (moved to Perambalur Constituency)
  3. Srirangam
  4. Tiruchirappalli - I (defunct)
  5. Tiruchirappalli - II (defunct)
  6. Tiruverumbur

Members of Parliament

Year Winning Candidate Party
1952 Dr.E.P Mathuram Independent
1957 M.K.M. Abdul Salam Indian National Congress
1962 K. Ananda Nambiar Communist Party of India
1967 Communist Party of India (Marxist)
1971 M. Kalyanasundaram Communist Party of India
1977
1980 N. Selvaraj Dravida Munnetra Kazhagam
1984 L. Adaikalaraj Indian National Congress
1989
1991
1996 Tamil Maanila Congress
1998 Rangarajan Kumaramangalam Bharatiya Janata Party
1999
2001^ Dalit Ezhilmalai All India Anna Dravida Munnetra Kazhagam
2004 L. Ganesan Marumalarchi Dravida Munnetra Kazhagam
2009 P. Kumar All India Anna Dravida Munnetra Kazhagam
2014
2019 Su. Thirunavukkarasar[3] Indian National Congress
2024 Durai Vaiyapuri Marumalarchi Dravida Munnetra Kazhagam

Election results

Vote share of Winning candidates
2024
51.35%
2019
59.70%
2014
47.49%
2009
41.65%
2004
63.68%
2001
48.38%
1999
54.61%
1998
48.39%
1996
62.65%
1991
63.99%
1989
61.06%
1984
58.05%
1980
54.32%
1977
57.10%
1971
49.34%
1967
50.32%
1962
47.80%
1957
42.60%
1951
43.82%

General elections 2024

2024 Indian general election: Tiruchirappalli
Party Candidate Votes % ±%
MDMK Durai Vaiko 542,213 51.35 51.35
AIADMK P. Karuppaiah 2,29,119 21.70 21.70
NTK Jallikattu Rajesh 1,07,458 10.18 3.91
AMMK Senthilnathan 1,00,747 9.54 −−−
NOTA None of the Above 13,849 1.31 −0.08
Margin of victory 3,13,094 29.65 −14.48
Turnout 10,56,843 67.98 −1.52
Registered electors 15,53,985 2.98
MDMK gain from INC Swing

General elections 2019

2019 Indian general election: Tiruchirappalli
Party Candidate Votes % ±%
INC Su. Thirunavukkarasar 621,285 59.70% 54.36%
DMDK Dr. V. Elangovan 1,61,999 15.57% 5.75%
Independent Charubala Tondaiman 1,00,818 9.69%
NTK V. Vinoth 65,286 6.27%
MNM V. Anandharaja 42,134 4.05%
NOTA None of the above 14,437 1.39% −0.98%
Margin of victory 4,59,286 44.13% 28.55%
Turnout 10,40,711 69.50% −0.63%
Registered electors 15,08,963 8.78%
INC gain from AIADMK Swing 12.21%

General elections 2014

2014 Indian general election: Tiruchirappalli
Party Candidate Votes % ±%
AIADMK P. Kumar 458,478 47.49% 5.84%
DMK Mu. Anbhalagan 3,08,002 31.90%
DMDK A. M. G. Vijaykumar 94,785 9.82% 1.21%
INC Charubala Tondaiman 51,537 5.34% −35.71%
NOTA None of the above 22,848 2.37%
CPI(M) S. Sridhar 17,039 1.76%
AAP P. Ravi 4,885 0.51%
Margin of victory 1,50,476 15.59% 14.98%
Turnout 9,65,402 71.28% 2.40%
Registered electors 13,87,140 29.98%
AIADMK hold Swing 5.84%

General elections 2009

2009 Indian general election: Tiruchirappalli
Party Candidate Votes % ±%
AIADMK P. Kumar 298,710 41.65% 8.58%
INC Charubala Tondaiman 2,94,375 41.05%
DMDK A. M. G. Vijaykumar 61,742 8.61%
BJP R. Lalitha Kumaramangalam 30,329 4.23%
Makkal Manadu P. Ravi 5,016 0.70%
BSP N. Kalyana Sundaram 4,897 0.68% 0.06%
Margin of victory 4,335 0.60% −30.00%
Turnout 7,17,165 67.33% 7.81%
Registered electors 10,67,193 −10.49%
AIADMK gain from MDMK Swing -22.02%

General elections 2004

2004 Indian general election: Tiruchirappalli
Party Candidate Votes % ±%
MDMK L. Ganesan 450,907 63.68%
AIADMK M. Paranjothi 2,34,182 33.07%
Independent P. Ravi 7,831 1.11%
BSP M. Ramesh 4,418 0.62%
Margin of victory 2,16,725 30.60% 17.70%
Turnout 7,08,137 59.48% 2.99%
Registered electors 11,92,254 −4.31%
MDMK gain from AIADMK Swing 9.06%

By-election 2001

2001 Byelection: Tiruchirappalli
Party Candidate Votes % ±%
AIADMK Dalit Ezhilmalai 343,874 48.38%
BJP M. N. Sukumar 3,26,461 45.93% −8.68%
Independent P. Ravi 16,417 2.31%
Independent G. Hariharan 6,053 0.82%
Margin of victory 17,413 2.45% −8.64%
Turnout 7,10,830 58.03% 1.63%
Registered electors 12,24,893 −1.69%
AIADMK gain from BJP Swing -6.23%

General elections 1999

1999 Indian general election: Tiruchirappalli
Party Candidate Votes % ±%
BJP Rangarajan Kumaramangalam 377,450 54.61% 52.48%
INC L. Adaikalaraj 2,88,253 41.71% 17.26%
TMC(M) M. Rajasekaran 17,256 2.50%
Margin of victory 89,197 12.91% 11.09%
Turnout 6,91,136 56.40% −10.91%
Registered electors 12,45,971 5.75%
BJP hold Swing -8.04%

General elections 1998

1998 Indian general election: Tiruchirappalli
Party Candidate Votes % ±%
BJP Rangarajan Kumaramangalam 305,233 48.39%
TMC(M) L. Adaikalaraj 2,93,778 46.57%
INC Subbha Somu 23,747 3.76%
PT K. Sachidanandam 4,979 0.79%
Margin of victory 11,455 1.82% −36.38%
Turnout 6,30,805 54.97% −12.34%
Registered electors 11,78,258 10.11%
BJP gain from TMC(M) Swing -14.26%

General elections 1996

1996 Indian general election: Tiruchirappalli
Party Candidate Votes % ±%
TMC(M) L. Adaikalaraj 434,149 62.65%
INC Dr. K. Gopal 1,69,441 24.45% −39.54%
CPI(M) T. K. Rangarajan 52,185 7.53% −24.10%
BJP D. Dhanabalan 14,778 2.13% −0.01%
Independent N. Sivaprakasam 3,116 0.45%
Margin of victory 2,64,708 38.20% 5.83%
Turnout 6,92,976 67.31% 4.14%
Registered electors 10,70,053 1.24%
TMC(M) gain from INC Swing -1.34%

General elections 1991

1991 Indian general election: Tiruchirappalli
Party Candidate Votes % ±%
INC L. Adaikalaraj 414,628 63.99% 2.93%
CPI(M) T. K. Rangarajan 2,04,922 31.63% −5.26%
BJP V. Parthasarathy 13,872 2.14%
JP G. Fredric 4,280 0.66%
Margin of victory 2,09,706 32.36% 8.18%
Turnout 6,47,962 63.17% −4.53%
Registered electors 10,56,965 0.36%
INC hold Swing 2.93%

General Elections 1989

1989 Indian general election: Tiruchirappalli
Party Candidate Votes % ±%
INC L. Adaikalaraj 429,185 61.06% 3.01%
CPI(M) T. K. Rangarajan 2,59,219 36.88%
JP E. Veluswamy 3,152 0.45%
Margin of victory 1,69,966 24.18% 6.50%
Turnout 7,02,847 67.70% −8.37%
Registered electors 10,53,144 32.40%
INC hold Swing 3.01%

General elections 1984

1984 Indian general election: Tiruchirappalli
Party Candidate Votes % ±%
INC L. Adaikalaraj 337,786 58.05%
DMK N. Selvaraj 2,34,881 40.37% −13.95%
Independent D. R. Govindaraj 3,115 0.54%
Margin of victory 1,02,905 17.68% 3.33%
Turnout 5,81,882 76.07% 4.13%
Registered electors 7,95,398 10.11%
INC gain from DMK Swing 3.73%

General Elections 1980

1980 Indian general election: Tiruchirappalli
Party Candidate Votes % ±%
DMK N. Selvaraj 278,485 54.32%
CPI(M) T. K. Rangarajan 2,04,886 39.96%
Independent V. Lalgudi Rajendran 23,133 4.51%
Margin of victory 73,599 14.35% −1.35%
Turnout 5,12,709 71.94% 3.00%
Registered electors 7,22,379 1.37%
DMK gain from CPI Swing -2.78%

General elections 1977

1977 Indian general election: Tiruchirappalli
Party Candidate Votes % ±%
CPI M. Kalyanasundaram 276,390 57.10%
INC(O) Y. Venkateswara Dikshidar 2,00,345 41.39%
Independent A. Lawrence 2,917 0.60%
Independent M. M. Ismail 2,421 0.50%
Margin of victory 76,045 15.71% 11.05%
Turnout 4,84,085 68.94% −4.61%
Registered electors 7,12,644 14.66%
CPI hold Swing 7.75%

General elections 1971

1971 Indian general election: Tiruchirappalli
Party Candidate Votes % ±%
CPI M. Kalyanasundaram 217,677 49.34%
INC(O) S. P. Thangavelu 1,97,127 44.69%
CPI(M) K. Ananda Nambiar 26,339 5.97%
Margin of victory 20,550 4.66% 4.03%
Turnout 4,41,143 73.55% −3.52%
Registered electors 6,21,540 15.73%
CPI gain from CPI(M) Swing -0.97%

General elections 1967

1967 Indian general election: Tiruchirappalli
Party Candidate Votes % ±%
CPI(M) K. Ananda Nambiar 202,879 50.32%
INC V. A. Muthiah 2,00,334 49.68% 4.74%
Margin of victory 2,545 0.63% −2.23%
Turnout 4,03,213 77.07% 0.48%
Registered electors 5,37,064 22.42%
CPI(M) gain from CPI Swing 2.52%

General elections 1962

1962 Indian general election: Tiruchirappalli
Party Candidate Votes % ±%
CPI K. Ananda Nambiar 156,706 47.80%
INC M. K. M. Abdul Salam 1,47,332 44.94% 2.34%
Independent S. S. Subramaniam 23,796 7.26%
Margin of victory 9,374 2.86% −16.20%
Turnout 3,27,834 76.60% 24.96%
Registered electors 4,38,690 5.00%
CPI gain from INC Swing 5.20%

General elections 1957

1957 Indian general election: Tiruchirappalli
Party Candidate Votes % ±%
INC M. K. M. Abdul Salam 91,910 42.60% 6.77%
CPI K. Ananda Nambiar 50,785 23.54%
Independent M. S. Mani 42,161 19.54%
Independent C. M. Srinivasan 13,804 6.40%
Independent N. Rukmani 10,765 4.99%
Independent Rengasami 6,327 2.93%
Margin of victory 41,125 19.06% 11.07%
Turnout 2,15,752 51.64% −9.11%
Registered electors 4,17,789 18.08%
INC gain from Independent Swing -1.22%

General elections 1952

1951–52 Indian general election: Tiruchirappalli
Party Candidate Votes % ±%
Independent E. Mathuram 94,184 43.82%
INC N. Halasyam 77,007 35.83% 35.83%
Independent T. S. Krishnamoorthi 21,966 10.22%
Socialist M. Nataraja 14,778 6.88%
Independent A. Nammalwar 7,017 3.26%
Margin of victory 17,177 7.99%
Turnout 2,14,952 60.75%
Registered electors 3,53,822 0.00%
Independent win (new seat)

See also

References

  1. ^ GE 2009 Statistical Report: Constituency Wise Detailed Result Archived 2013-08-02 at the Wayback Machine
  2. ^ "List of Parliamentary and Assembly Constituencies" (PDF). Tamil Nadu. Election Commission of India. Archived from the original (PDF) on 4 May 2006. Retrieved 11 October 2008.
  3. ^ "General elections to the 17th Lok Sabha, 2019 - List of members elected" (PDF). New Delhi: Election Commission of India. 25 May 2019. p. 27. Retrieved 2 June 2019.

10°48′N 78°42′E / 10.8°N 78.7°E / 10.8; 78.7
Kembali kehalaman sebelumnya