1976 United States presidential election in Idaho
The 1976 United States presidential election in Idaho took place on November 2, 1976, as part of the 1976 United States presidential election . State voters chose four representatives, or electors, to the Electoral College , who voted for president and vice president .
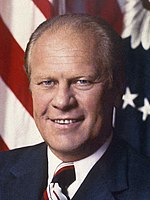
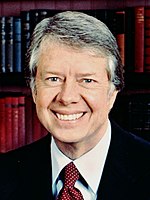
Idaho was won by incumbent President Gerald Ford (R –Michigan ), with 59.9 percent of the popular vote, against Jimmy Carter (D –Georgia ), with 37.1 percent of the popular vote. Two third party candidates accumulated a portion of the vote greater than one percent: Lester Maddox (AIA –Georgia ) and Roger MacBride (L –Vermont ). Despite losing in Idaho, Carter went on to win the national election and became the 39th president of the United States . Idaho had previously voted Republican ten times, Democrat ten times, and Populist once.
With 59.88 percent of the popular vote, Idaho would prove to be Ford's second strongest state in the 1976 election after neighboring Utah .[ 1] Blaine , Boundary , or Butte Counties, as well as the first to do so without carrying Elmore , Idaho , Kootenai , or Shoshone Counties since Grover Cleveland in 1892 , and the first to do so without carrying Bannock or Bonner Counties since Woodrow Wilson in 1912 .
Despite this, this would prove to be the high water mark for Democrats since Lyndon Johnson last carried the state in 1964 : as of 2024, no Democrats have met Carter's 37.12%, the closest being Barack Obama 's 36.09% in 2008 .
Results
Results by county
County
Gerald Ford
Jimmy Carter
Lester Maddox[ 3]
Roger MacBride[ 3]
Lyndon LaRouche[ 3]
Margin
Total votes cast
#
%
#
%
#
%
#
%
#
%
#
%
Ada
41,135
64.39%
21,125
33.07%
717
1.12%
737
1.15%
175
0.27%
20,010
31.32%
63,889
Adams
809
54.74%
639
43.23%
15
1.01%
10
0.68%
5
0.34%
170
11.51%
1,478
Bannock
13,172
53.65%
10,261
41.80%
485
1.98%
577
2.35%
55
0.22%
2,911
11.85%
24,550
Bear Lake
2,094
66.60%
960
30.53%
74
2.35%
15
0.48%
1
0.03%
1,134
36.07%
3,144
Benewah
1,458
47.58%
1,549
50.55%
37
1.21%
16
0.52%
4
0.13%
-91
-2.97%
3,064
Bingham
7,327
60.83%
4,347
36.09%
219
1.82%
119
0.99%
33
0.27%
2,980
24.74%
12,045
Blaine
2,176
56.13%
1,604
41.37%
25
0.64%
69
1.78%
3
0.08%
572
14.76%
3,877
Boise
684
58.61%
433
37.10%
22
1.89%
24
2.06%
4
0.34%
251
21.51%
1,167
Bonner
4,549
51.37%
4,065
45.91%
161
1.82%
60
0.68%
20
0.23%
484
5.46%
8,855
Bonneville
15,793
66.44%
7,230
30.41%
414
1.74%
275
1.16%
60
0.25%
8,563
36.03%
23,772
Boundary
1,458
52.15%
1,217
43.53%
92
3.29%
24
0.86%
5
0.18%
241
8.62%
2,796
Butte
751
51.16%
663
45.16%
35
2.38%
19
1.29%
0
0.00%
88
6.00%
1,468
Camas
288
62.20%
160
34.56%
8
1.73%
6
1.30%
1
0.22%
128
27.64%
463
Canyon
17,263
62.91%
9,460
34.47%
405
1.48%
277
1.01%
36
0.13%
7,803
28.44%
27,441
Caribou
2,253
64.83%
1,110
31.94%
83
2.39%
24
0.69%
5
0.14%
1,143
32.89%
3,475
Cassia
4,575
66.38%
1,881
27.29%
368
5.34%
64
0.93%
4
0.06%
2,694
39.09%
6,892
Clark
334
64.48%
169
32.63%
7
1.35%
6
1.16%
2
0.39%
165
31.85%
518
Clearwater
1,469
44.01%
1,752
52.49%
71
2.13%
33
0.99%
13
0.39%
-283
-8.48%
3,338
Custer
850
60.33%
516
36.62%
40
2.84%
2
0.14%
1
0.07%
334
23.71%
1,409
Elmore
2,808
55.46%
2,164
42.74%
61
1.20%
26
0.51%
4
0.08%
644
12.72%
5,063
Franklin
2,720
67.80%
1,157
28.84%
104
2.59%
24
0.60%
7
0.17%
1,563
38.96%
4,012
Fremont
2,581
61.94%
1,445
34.68%
115
2.76%
21
0.50%
5
0.12%
1,136
27.26%
4,167
Gem
2,401
52.75%
1,978
43.45%
118
2.59%
52
1.14%
3
0.07%
423
9.30%
4,552
Gooding
2,909
58.54%
1,923
38.70%
74
1.49%
59
1.19%
4
0.08%
986
19.84%
4,969
Idaho
3,185
55.96%
2,323
40.81%
122
2.14%
54
0.95%
8
0.14%
862
15.15%
5,692
Jefferson
3,599
65.14%
1,745
31.58%
157
2.84%
21
0.38%
3
0.05%
1,854
33.56%
5,525
Jerome
3,188
61.81%
1,800
34.90%
113
2.19%
52
1.01%
5
0.10%
1,388
26.91%
5,158
Kootenai
10,493
57.78%
7,225
39.79%
306
1.69%
92
0.51%
43
0.24%
3,268
17.99%
18,159
Latah
6,846
54.90%
5,314
42.61%
96
0.77%
174
1.40%
40
0.32%
1,532
12.29%
12,470
Lemhi
1,685
56.37%
1,159
38.78%
117
3.91%
25
0.84%
3
0.10%
526
17.59%
2,989
Lewis
824
46.61%
898
50.79%
21
1.19%
18
1.02%
7
0.40%
-74
-4.18%
1,768
Lincoln
909
57.75%
615
39.07%
36
2.29%
13
0.83%
1
0.06%
294
18.68%
1,574
Madison
4,190
72.38%
1,320
22.80%
153
2.64%
58
1.00%
68
1.17%
2,870
49.58%
5,789
Minidoka
3,600
56.44%
2,441
38.27%
252
3.95%
80
1.25%
5
0.08%
1,159
18.17%
6,378
Nez Perce
6,151
48.22%
6,324
49.58%
126
0.99%
110
0.86%
44
0.34%
-173
-1.36%
12,755
Oneida
1,065
61.14%
637
36.57%
31
1.78%
7
0.40%
2
0.11%
428
24.57%
1,742
Owyhee
1,519
57.52%
1,054
39.91%
41
1.55%
21
0.80%
6
0.23%
465
17.61%
2,641
Payette
3,115
57.44%
2,195
40.48%
75
1.38%
35
0.65%
3
0.06%
920
16.96%
5,423
Power
1,374
49.96%
1,286
46.76%
52
1.89%
38
1.38%
0
0.00%
88
3.20%
2,750
Shoshone
3,570
51.67%
3,216
46.55%
77
1.11%
39
0.56%
7
0.10%
354
5.12%
6,909
Teton
904
63.04%
514
35.84%
12
0.84%
3
0.21%
1
0.07%
390
27.20%
1,434
Twin Falls
12,659
65.82%
6,085
31.64%
310
1.61%
145
0.75%
34
0.18%
6,574
34.18%
19,233
Valley
1,374
59.33%
897
38.73%
22
0.95%
20
0.86%
3
0.13%
477
20.60%
2,316
Washington
2,044
53.47%
1,693
44.28%
66
1.73%
14
0.37%
6
0.16%
351
9.19%
3,823
Totals
204,151
59.88%
126,549
37.12%
5,935
1.74%
3,558
1.04%
739
0.22%
77,602
22.76%
340,932
Counties that flipped from Republican to Democratic
See also
References


