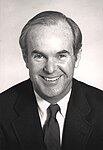
1988 Washington gubernatorial election
1988 Washington gubernatorial election
County resultsGardner : 50–60% 60–70%Williams : 50–60% 60–70%
The 1988 Washington gubernatorial election was held on November 8, 1988. Incumbent Democratic governor Booth Gardner won a second term, defeating Republican state representative Bob Williams in a landslide. This election was the first time since 1960 that an incumbent Democratic governor of Washington was re-elected.
Gardner won the highest share of the vote since Clarence Martin in 1936 . Gardner's 62.21% of the vote is third-highest of any gubernatorial candidate in Washington's history.[ a]
Primary election
Candidates
Democratic
Jeanne Dixon
Ted Parker Fix
Booth Gardner , incumbent governor of WashingtonRichard "Onery Dick" Short
Republican
Independent
Baba Jeanne "BJ" Mangaoang, party leader
Results
Blanket primary results by county:
General election
Candidates
Debates
Results
Results by county
Gardner's landslide win made him the first Democrat since Clarence Martin in 1936 to carry Chelan County , Garfield County , Lincoln County , San Juan County , Walla Walla County , and Whitman County . However, since this election, no Democrat has won Chelan County , Douglas County , Ferry County , Garfield County , Grant County , Lincoln County , and Okanogan County .
County[ 2]
Booth Gardner
Bob Williams
Margin
Total votes cast
#
%
#
%
#
%
Adams
2,228
49.83%
2,243
50.17%
-15
-0.34%
4,471
Asotin
4,345
65.74%
2,264
34.26%
2,081
31.49%
6,609
Benton
15,407
34.44%
29,333
65.56%
-13,926
-31.13%
44,740
Chelan
11,037
58.10%
7,961
41.90%
3,076
16.19%
18,998
Clallam
13,776
59.43%
9,406
40.57%
4,370
18.85%
23,182
Clark
45,072
57.67%
33,086
42.33%
11,986
15.34%
78,158
Columbia
918
46.55%
1,054
53.45%
-136
-6.90%
1,972
Cowlitz
14,154
49.25%
14,584
50.75%
-430
-1.50%
28,738
Douglas
5,208
54.80%
4,296
45.20%
912
9.60%
9,504
Ferry
1,161
57.16%
870
42.84%
291
14.33%
2,031
Franklin
4,438
40.25%
6,587
59.75%
-2,149
-19.49%
11,025
Garfield
783
58.26%
561
41.74%
222
16.52%
1,344
Grant
9,383
51.52%
8,830
48.48%
553
3.04%
18,213
Grays Harbor
16,951
69.79%
7,336
30.21%
9,615
39.59%
24,287
Island
12,369
57.14%
9,277
42.86%
3,092
14.28%
21,646
Jefferson
6,378
65.90%
3,300
34.10%
3,078
31.80%
9,678
King
453,572
69.89%
195,378
30.11%
258,194
39.79%
648,950
Kitsap
42,616
60.62%
27,683
39.38%
14,933
21.24%
70,299
Kittitas
6,723
63.37%
3,886
36.63%
2,837
26.74%
10,609
Klickitat
3,482
57.09%
2,617
42.91%
865
14.18%
6,099
Lewis
10,256
43.39%
13,380
56.61%
-3,124
-13.22%
23,636
Lincoln
2,423
51.12%
2,317
48.88%
106
2.24%
4,740
Mason
9,699
60.94%
6,217
39.06%
3,482
21.88%
15,916
Okanogan
6,824
57.33%
5,078
42.67%
1,746
14.67%
11,902
Pacific
5,513
67.39%
2,668
32.61%
2,845
34.78%
8,181
Pend Oreille
2,317
60.43%
1,517
39.57%
800
20.87%
3,834
Pierce
119,459
63.28%
69,307
36.72%
50,152
26.57%
188,766
San Juan
3,814
65.87%
1,976
34.13%
1,838
31.74%
5,790
Skagit
19,902
60.33%
13,089
39.67%
6,813
20.65%
32,991
Skamania
1,653
52.36%
1,504
47.64%
149
4.72%
3,157
Snohomish
105,357
62.53%
63,123
37.47%
42,234
25.07%
168,480
Spokane
80,678
56.72%
61,571
43.28%
19,107
13.43%
142,249
Stevens
5,880
48.48%
6,249
51.52%
-369
-3.04%
12,129
Thurston
42,583
62.74%
25,292
37.26%
17,291
25.47%
67,875
Wahkiakum
820
52.06%
755
47.94%
65
4.13%
1,575
Walla Walla
8,916
50.36%
8,789
49.64%
127
0.72%
17,705
Whatcom
31,321
62.32%
18,934
37.68%
12,387
24.65%
50,255
Whitman
9,337
60.78%
6,026
39.22%
3,311
21.55%
15,363
Yakima
29,695
49.63%
30,137
50.37%
-442
-0.74%
59,832
Totals
1,166,448
62.21%
708,481
37.79%
457,967
24.43%
1,874,929
Counties that flipped from Republican to Democratic
Counties that flipped from Democratic to Republican
Notes
References


